
See the whole chain, one store at a time.
Make decisions from real-time sales, shrink, inventory, projection, purchase and marketing insights. Reports are customizable, and your data is available on the web, iOS and Android.
Answers for every store and every role
Dashboards and reports that update live
Track sales, shrink, inventory, projection, purchase and marketing insights in real time, and customize reports to the way your team works.
A report builder you can shape
Choose rows by store, department, category or item. Group by day, week, month or quarter, or by average hour or day of week. Switch between sales and margin.
Filters that narrow fast
Limit any report by date range, stores, departments and items, and compare performance across locations side by side.
Comparisons built in
Reports such as the Shrink Report compare against the same dates last year by default, and you can choose a different comparison range.
Available anywhere
Use the same dashboards and reports on iOS, Android and the web, so your data is always at hand.
Right data, right person
Fine-grained access control limits what each employee sees, down to the store, department and item. Automated email reports and recaps keep everyone informed.
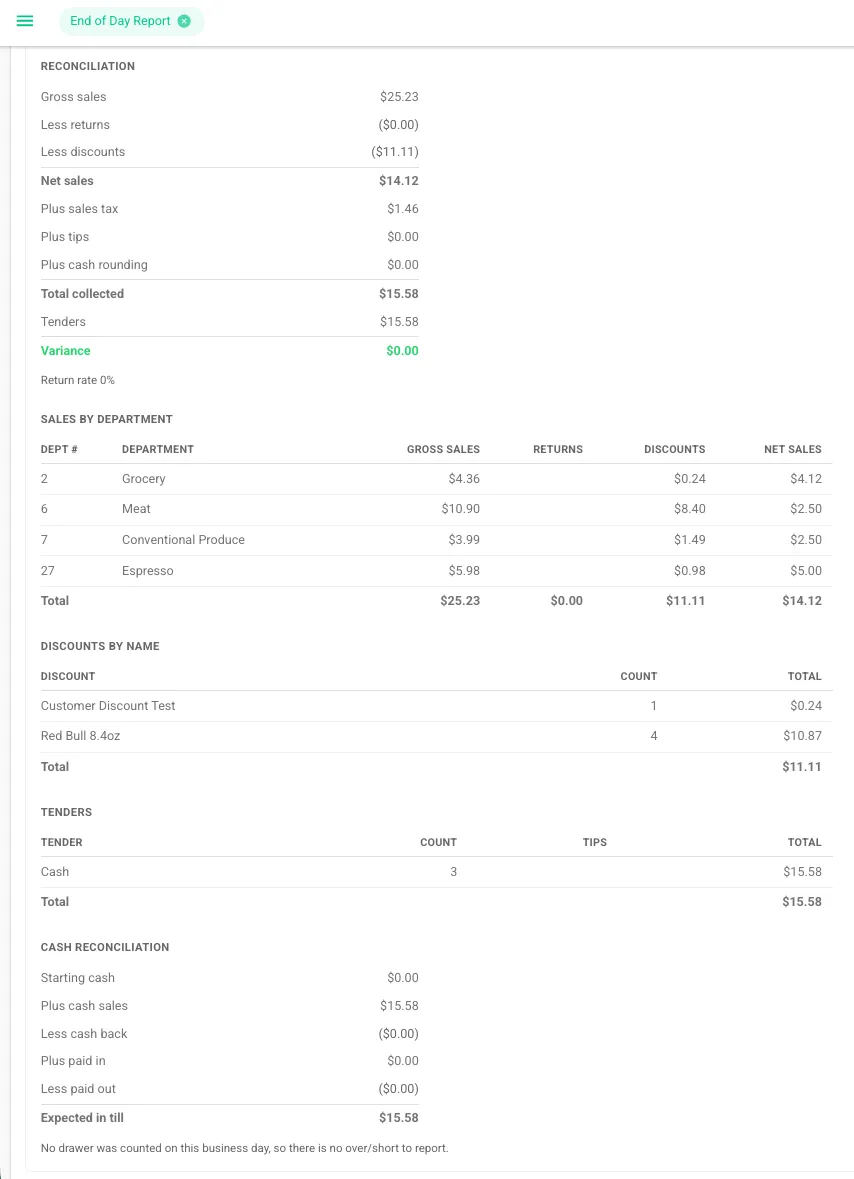
End of Day, reconciled
One report closes out the business day for a store, a region or all stores. It covers every lane and shift in the period.
- Reconciliation: gross sales, returns, discounts, tax, tips and variance
- Sales by department and discounts by name
- Tenders by payment type
- Cash reconciliation, with the expected amount in the till
At a glance
- Platforms
- Web, iOS and Android.
- Report rows
- Store, department, category or item.
- Grouping
- Day, week, month, quarter, average by hour, average by day of week.
- Metrics
- Sales and margin.
- Filters
- Date range, stores, departments and items.
- Access
- Limited by store, department and item.
- Delivery
- Email alerts and recaps.
Common questions
Can I see analytics on my phone?
Yes. Dashboards and reports are available on iOS and Android, and as a web app.
Can I compare stores against each other?
Yes. Pick more than one store in the report builder to compare performance across locations.
Can I see margin as well as sales?
Yes. The report builder lets you switch the metric between sales and margin using the same filters.
Can I limit what each person can see?
Yes. Access control works down to the store, department and even item level.
Can reports be sent automatically?
Yes. Basket sends automated email reports and recaps.
The rest of the Basket platform.
- Point of sale
Cloud checkout that works with any processor and keeps selling offline.
- Back office
Items, pricing, taxes, users and tags in one place, tied to the lanes.
- Pricing and promotions
Margin-based price rules, TPRs and promotions, with discount reporting.
- Inventory management
Receiving, shrink and counts from a handheld, with live on-hand reports.
- Customer engagement
Points, offers and club rewards in a shopper app tied to checkout.
- Ecommerce
A branded online store with pickup, delivery and a picking app, on your own catalog.
- Purchasing and vendors
Purchase orders by vendor and store, with vendor records and costs in one place.
- AI invoice scanning
Scan a vendor invoice to receive a delivery, and create new products from the same scan.
- Tag printing
Design your own tags and print them with each store’s prices to Zebra or PDF.
See analytics and reporting in action.
Tell us about your stores and we will reply by email to set up a demo.
Already a customer? Contact support.