
The Sales Report Builder allows you to analyze sales performance across your stores, departments, categories, and individual items. By selecting a report type, grouping, metric, and filters, you can customize the report to view your data in the format that is most useful to you.
Open the Sales Report Builder
- This document covers a step-by-step guide to edit, and generate a sales report in the Basket point of sale system.
- Using the navigation drop-down menu, on the upper left hand corner of the screen, select Sales > Sales Report Builder.
The report builder is divided into several options that allow you to customize the data displayed:
- Type – Choose what you want to analyze.
- Grouping – Choose how the data should be organized.
- Metric – Select the performance metric you want to view.
- Filters – Narrow the report by date range, store, department, and other available options.
Choose a Report Type
At the top of the report, select the type of data you would like to analyze.
Available options include:
- Store – Compare sales performance between store locations.
- Department – Analyze performance by department.
- Category – View sales data by item category.
- Item – Review performance for individual items.
The selected type determines what appears in the rows of your report.
For example, selecting Store displays each store as a separate row, while selecting Item allows you to analyze sales data for specific products.
Select How to Group Your Data
Next, choose how you would like the report data to be grouped.
Available grouping options include:
- Day – Displays data by individual day.
- Week – Groups results by week.
- Month – Groups results by month.
- Quarter – Groups results by quarter.
- Avg by Hour – Shows average performance by hour of the day.
- Avg by Day of Week – Shows average performance for each day of the week.
The grouping you select determines how the report columns are organized.
For example, selecting Day displays each date as a separate column, making it easy to compare daily performance across stores or departments.
Selecting Avg by Day of Week allows you to identify patterns in customer activity and sales between days such as Monday, Wednesday, and Saturday.
Select a Metric
Depending on the report type and grouping selected, you may have the option to choose the metric displayed in the report.
Available metrics may include:
- Sales – Displays total sales performance.
- Margin – Displays the profit margin percentage.
Use these options to switch between analyzing revenue and profitability.
Apply Report Filters
Use the filters below the report options to narrow down the data you want to analyze.
Date Range
Select the date range you would like to include in your report.
The report will only display sales data that falls within the selected period.
Stores
Select one or more stores to include in the report. Your selected stores will appear in a filter box near the top of the report.
If multiple stores are selected, the report can be used to compare performance across locations.
Departments
You can also filter the report by one or more departments.
For example, you may choose to analyze sales from only Produce and Specialty Cheese rather than viewing data from the entire store.
Item Filters
When viewing an Item report, you can further narrow your results by selecting a specific item.
Active filters appear above the report and can be removed by clicking the X next to the filter.
Understanding the Sales Report
The information displayed in the report will change based on the Type, Grouping, Metric, and filters you select.
For example, when using:
- Type: Store
- Grouping: Day
- Metric: Sales
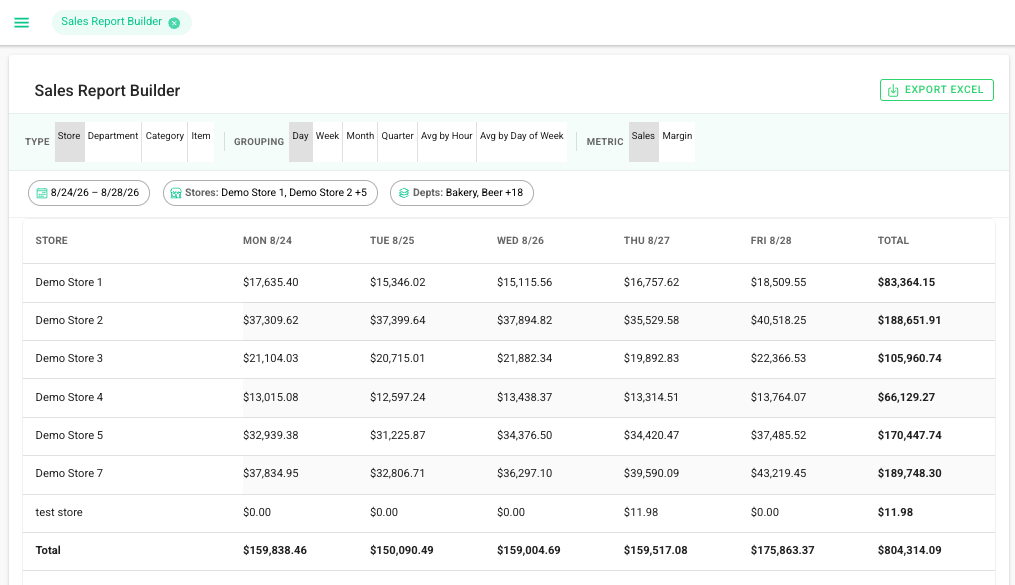
Each row represents a store, while each column represents a day within the selected date range.
This makes it easy to compare daily sales performance between multiple store locations.
The Total row at the bottom combines the results for all displayed stores.
Example
This view allows you to quickly identify trends, compare locations, and see which days generated the highest sales.
Understanding Average Reports
When using groupings such as Avg by Day of Week or Avg by Hour, the report displays average performance rather than totals for individual dates.
For example, an Item report grouped by Avg by Day of Week may display:
- Average Sales
- Margin
- Average Customers
- Average Items
Average Sales
Shows the average amount of sales generated during the selected grouping period.
Margin
Displays the average profit margin as a percentage.
Average Customers
Shows the average number of customers associated with the selected data.
Average Items
Displays the average number of items sold.
This type of report can be especially helpful for identifying recurring sales patterns.
For example, you may discover that a particular item sells significantly better on weekends than during the rest of the week.
Export the Report to Excel
Once you have configured your report, click EXPORT EXCEL in the upper-right corner of the screen.
This allows you to download the report data for additional analysis, record keeping, or sharing with your team.
Tips for Using the Sales Report Builder
Understanding the Sales Report Builder
The Sales Report Builder gives you a flexible way to analyze your business data from multiple perspectives. By combining different report types, groupings, metrics, and filters, you can compare store performance, identify sales trends, evaluate margins, and better understand customer purchasing patterns.
Use broader reports to identify trends, then apply filters to drill down into the stores, departments, categories, or items contributing to those results.