
How to View Category Sales Report
This document covers a step-by-step guide to generating a category sales report in the Basket Point of Sale system.
- Using the navigation drop-down menu, on the upper left hand corner of the screen, select Sales > Category Sales Report.
You will be able to filter the sales performance data of an item relative to the time period of your choosing. Please select from the drop-down menu on the left the period you wish to analyze.
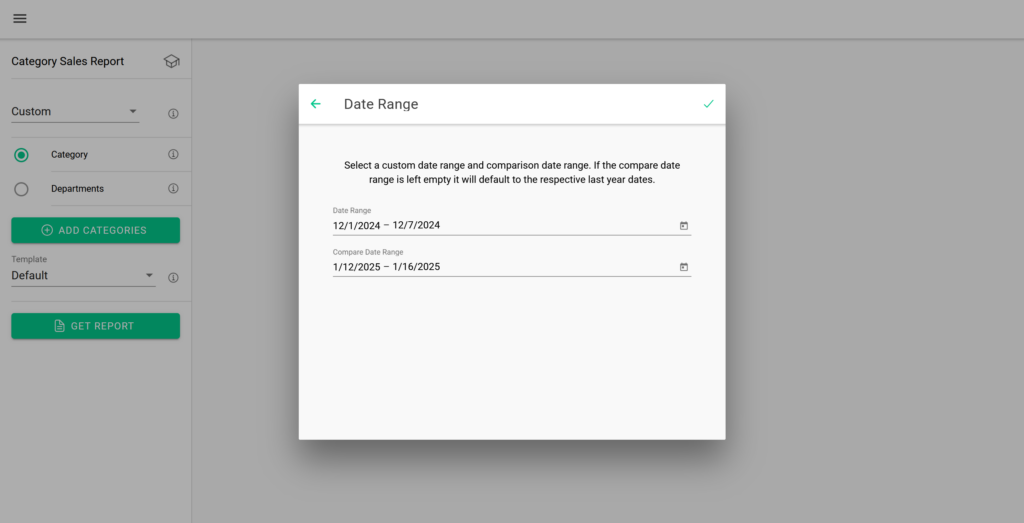
You can filter the report using the following category attributes:
Category: Filters the report by the category’s assigned name or number. Click “Add Category” to search by category name or category number, then select a category to add it to the report query.
Department: Filters the report by the category’s assigned department. Open the drop-down list of departments to select the respective departments you wish to be queried in the report.
Template:
Control which columns are displayed in the report.
- By default, all available columns are included.
- Click Add New to create a custom report template.
- Drag and drop fields from Available Columns to Selected Columns to customize the report layout.
Generate the Report
After selecting your filters, click Get Report to generate the report.
Download the Report
To save a copy of the report, click Export Excel at the top right of the report. The report will be downloaded as an .xlsx (Microsoft Excel) file.