
How to View the Shrink Dashboard
- This document covers a step-by-step guide on navigating and viewing the shrink dashboard in the Basket Point of Sale system.
- Using the navigation drop-down menu, on the upper left hand corner of the screen, select Inventory > Shrink Dashboard.
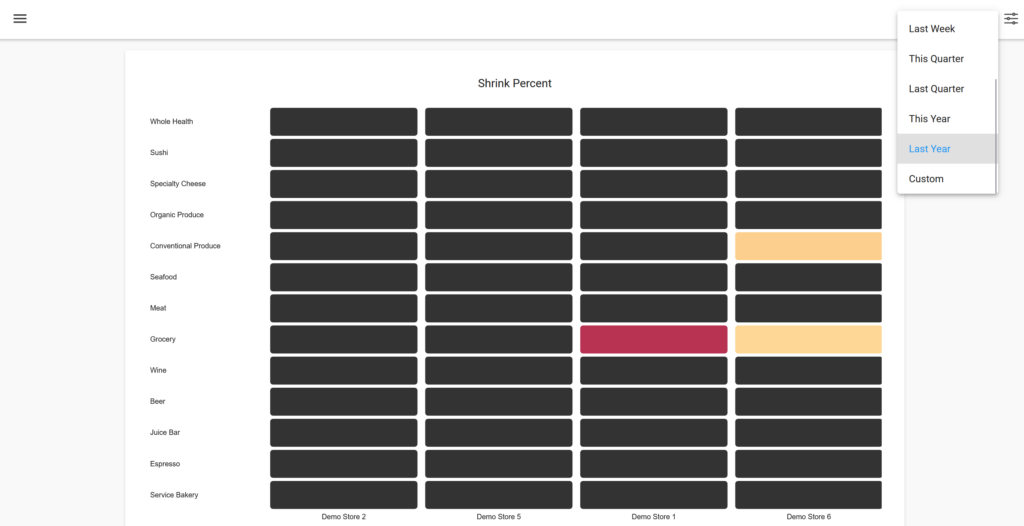
Upon navigation to the shrink dashboard, you will be presented with a map that correlates stores across all of your created departments. Simply hover over the intersection of a store and department to view both the shrink percentage and shrink cost at that respective store’s department.
You can filter the shrink data generated by time period, by simply navigating to the upper right hand corner of the screen, and selecting the time period you desire.
To view more further insights regarding the specifics of your store’s shrink data, navigate further down the page to get an overall glance at the specific date by store, department and UPC respectively.
If you wish to save a copy of any table for stores, departments or items, simply click the download button located towards the bottom of each table and save as an .xlsx file.